The new version 1.6.7 of our VOSviewer software, which we released today, offers a number of incremental improvements. For instance, when creating a co-authorship map, publications with very large numbers of authors (e.g., many hundreds or even thousands of authors in the case of publications in high energy physics) can be ignored, which prevents the co-authorship links from such ‘hyperauthorship’ publications from dominating the map. Also, when creating a term co-occurrence map, section labels in structured abstracts (e.g., labels such as background, methods, and findings in the abstracts of medical publications) can be filtered out, so that these labels do not distort the map.
Farewell rainbow
The above improvements will be relatively invisible to many VOSviewer users. However, there is one improvement that will be immediately visible to any user of the software. For the first time in the almost ten-year history of VOSviewer, we have completely revised the colors used in the visualizations produced by the software. In particular, we have said goodbye to the well-known rainbow color scheme. This color scheme offers a gradual transition from blue to cyan, green, yellow, orange, and finally red. It was used in the overlay and density visualizations in previous versions of VOSviewer.
Below we present an example of an overlay and a density visualization produced using the rainbow color scheme available in the old version 1.6.6 of VOSviewer. The visualizations show a term co-occurrence map created based on titles and abstracts of articles in Journal of Informetrics, Journal of the Association for Information Science and Technology, and Scientometrics in the period 2007–2016. The color of a term in the overlay visualization indicates the average publication year of the articles in which the term occurs. Terms occurring primarily in recent articles are colored yellow, orange, or red. These terms can be found mainly in the left area in the overlay visualization, which is the area that represents scientometric research.

Overlay visualization using the rainbow color scheme.

Density visualization using the rainbow color scheme.
Why is it time to say goodbye to the rainbow color scheme? The rainbow color scheme is very popular. It is used in scientific visualizations in many different fields of science, and for a long time it has for instance been the default choice in MATLAB, a computer program that is often used for creating scientific visualizations. Many people seem to like the rainbow color scheme, probably because they are accustomed to it and because it has a pleasing appearance. However, despite its popularity, the rainbow color scheme is heavily criticized by visualization experts, who have pointed out at least three problems of this color scheme. First, the rainbow color scheme is confusing because colors are not perceptually ordered. People do not have an intuitive feeling for the order of the colors. Second, because there is a lack of color variation in certain parts of the rainbow color scheme, small details in the underlying data can be obscured. And third, the rainbow color scheme can be misleading because it gives the incorrect impression that there are sharp transitions in the underlying data. A more in-depth discussion of these problems, including concrete examples, can for instance be found here or here.
New colors for the overlay and density visualizations
In VOSviewer version 1.6.7, we introduce a new default color scheme for the overlay and density visualizations. This color scheme is called viridis. It provides a transition from blue to green to yellow. In addition to viridis, we also make available a number of other color schemes. All color schemes were obtained from Matplotlib, a plotting library for the Python programming language. Matplotlib offers a rich variety of color schemes, and a number of these schemes are now available in VOSviewer. The rainbow color scheme is also still available, but it is no longer the default choice, and in fact we do not recommend the use of this color scheme. Below we present the same overlay and density visualizations as above, but the visualizations have now been produced using the viridis color scheme.
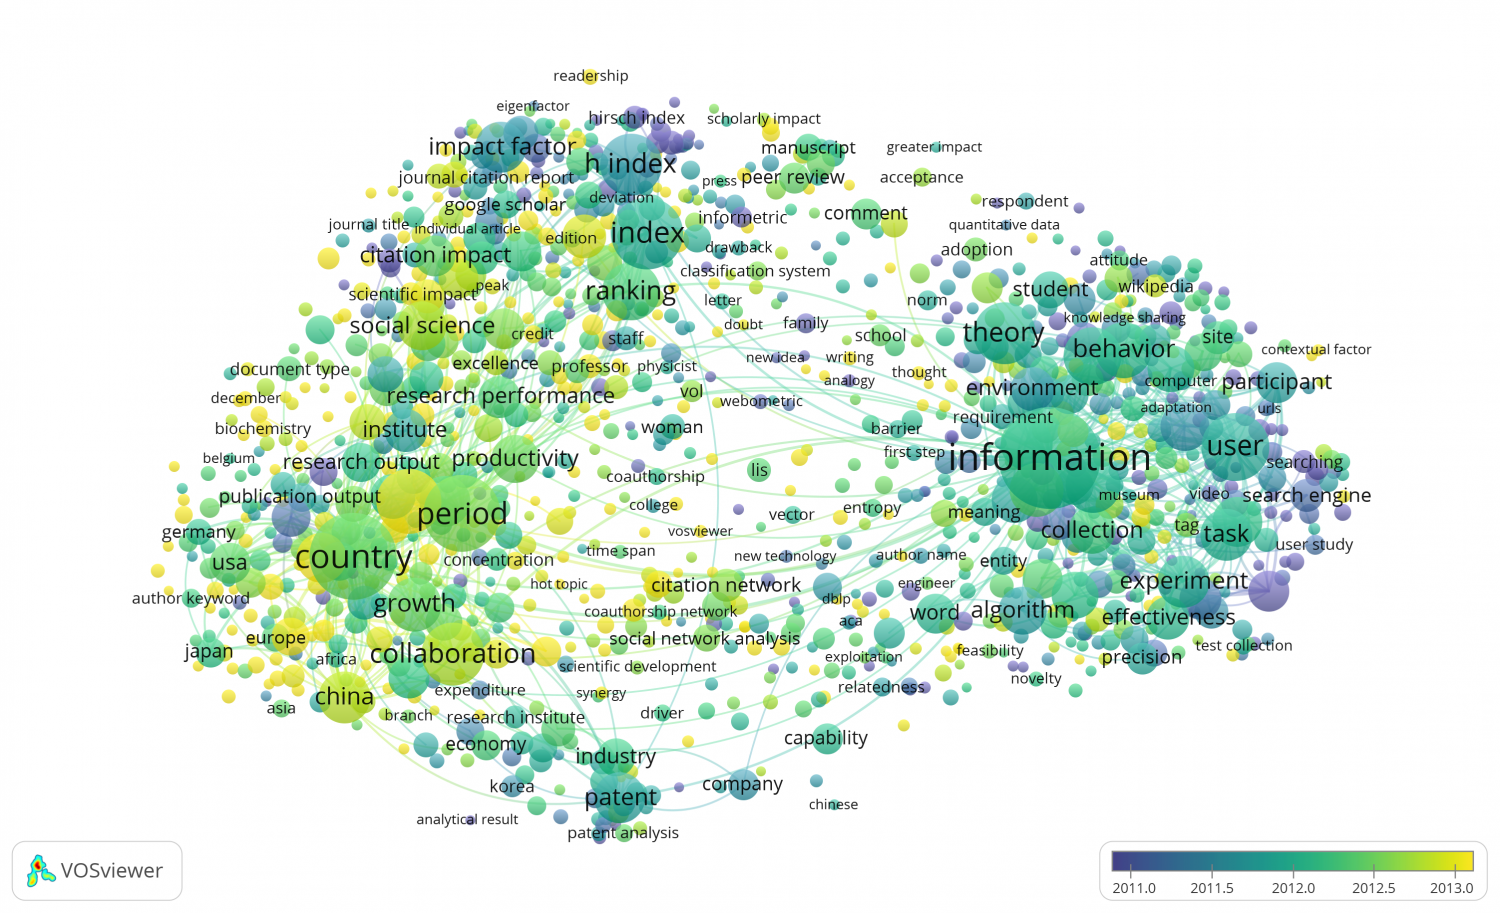
Overlay visualization using the viridis color scheme.
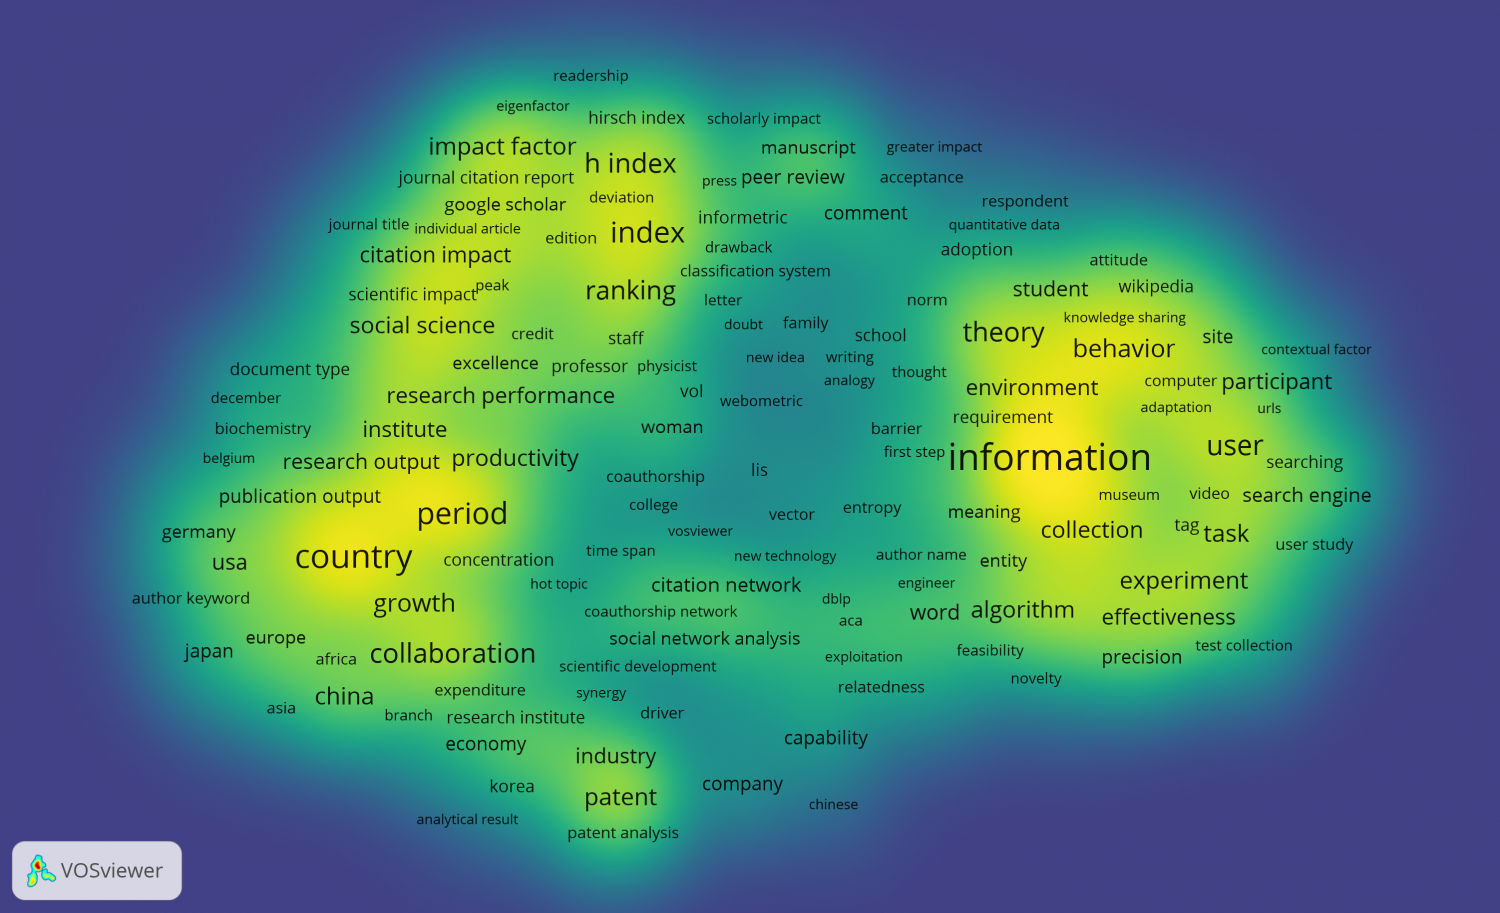
Density visualization using the viridis color scheme.
Viridis and the other new color schemes for the overlay and density visualizations are perceptually uniform. As explained in the Matplotlib user guide, the idea of a perceptually uniform color scheme is that “equal steps in data are perceived as equal steps in the color space”. Perceptual uniformity helps to overcome the problems of the rainbow color scheme. We note that we made some minor adjustments to Matplotlib’s color schemes in order to make them suitable for VOSviewer. In particular, we removed the darkest parts of some of the color schemes. Dark colors are problematic in VOSviewer because they cause the labels of items (by default presented in black) to be difficult to read.
Below an example is presented of an overlay visualization produced using another new color scheme introduced in VOSviewer version 1.6.7, the white-blue-purple color scheme. The color of a term indicates the share of the articles in which the term occurs that have been authored by institutions located in the Netherlands. The activity of Dutch institutions is concentrated mainly in the upper-left area in the visualization, which covers research on citation analysis. The white-blue-purple color scheme is especially useful when a limited number of items need to be highlighted. In our example, the color scheme is used to highlight terms that occur prominently in articles authored by Dutch institutions.
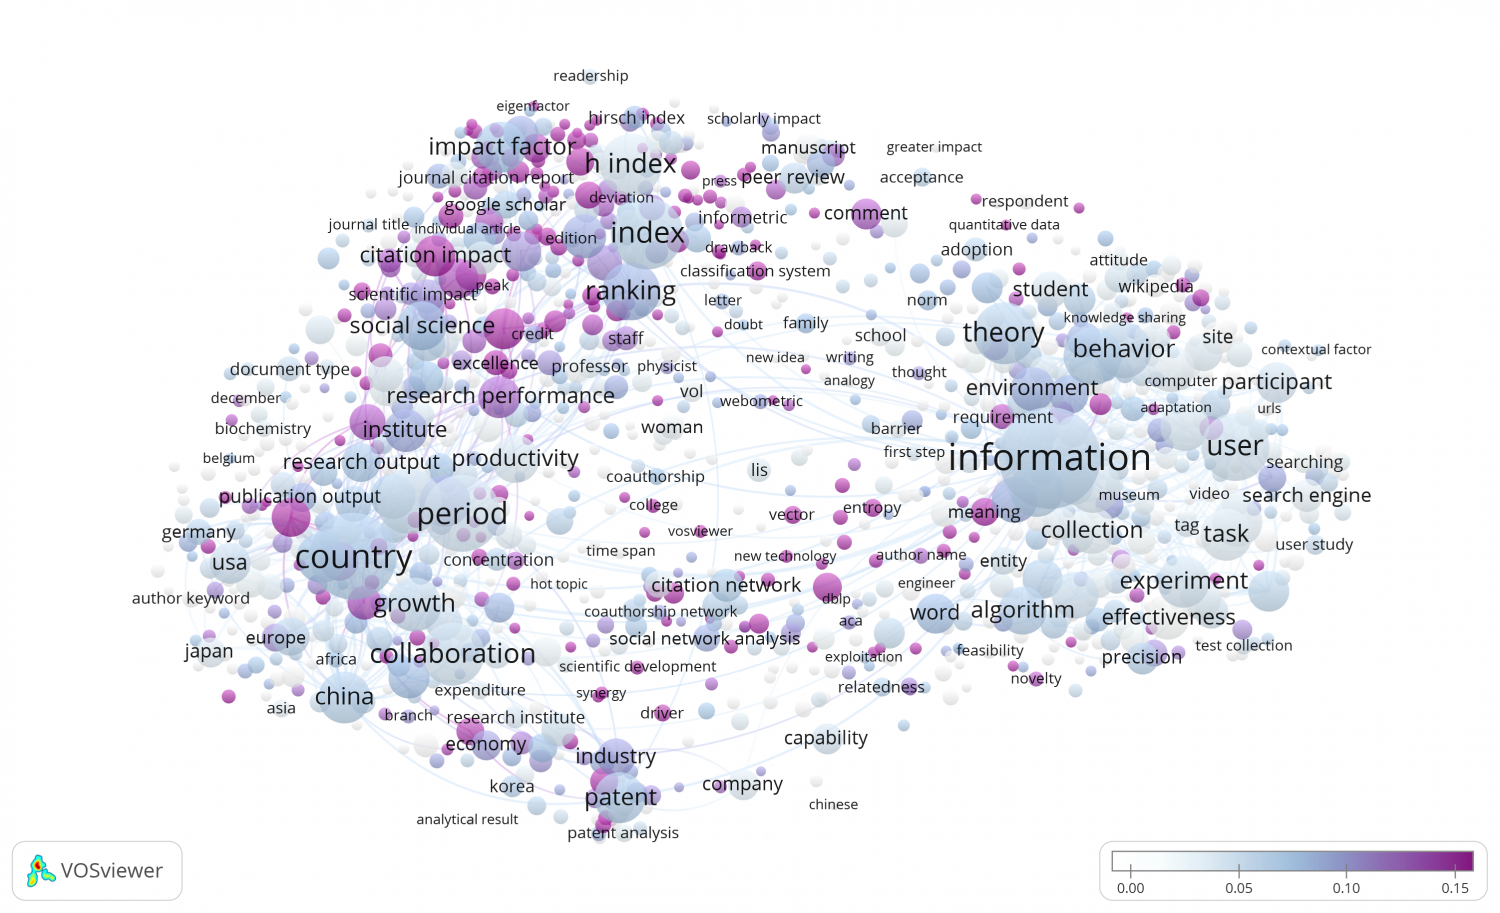
Overlay visualization using the white-blue-purple color scheme.
A final example of an overlay visualization produced using a new color scheme is presented below. We now use the coolwarm color scheme. This is a so-called diverging scheme. Such a color scheme is useful when there is a central value that can serve as a reference point in interpreting the visualization. In the coolwarm scheme, items with an average value are colored white, while items with a value above or below the average are colored red or blue, respectively. In the visualization presented below, the value of a term is given by the average citation score of the articles in which the term occurs, where the citation score of an article has been normalized for the age of the article. A term with an average normalized citation score of one, colored white in the visualization, occurs in articles that on average have received exactly the number of citations to be expected based on the age of the articles. Red terms have an average normalized citation score above one, which means that they occur in articles that have received more citations than expected. On the other hand, the average normalized citation score of blue terms is below one, meaning that these terms occur in articles whose number of citations is below expectation. As can be seen, the most highly cited research can be found in the top-left area in the visualization, covering research on citation analysis.
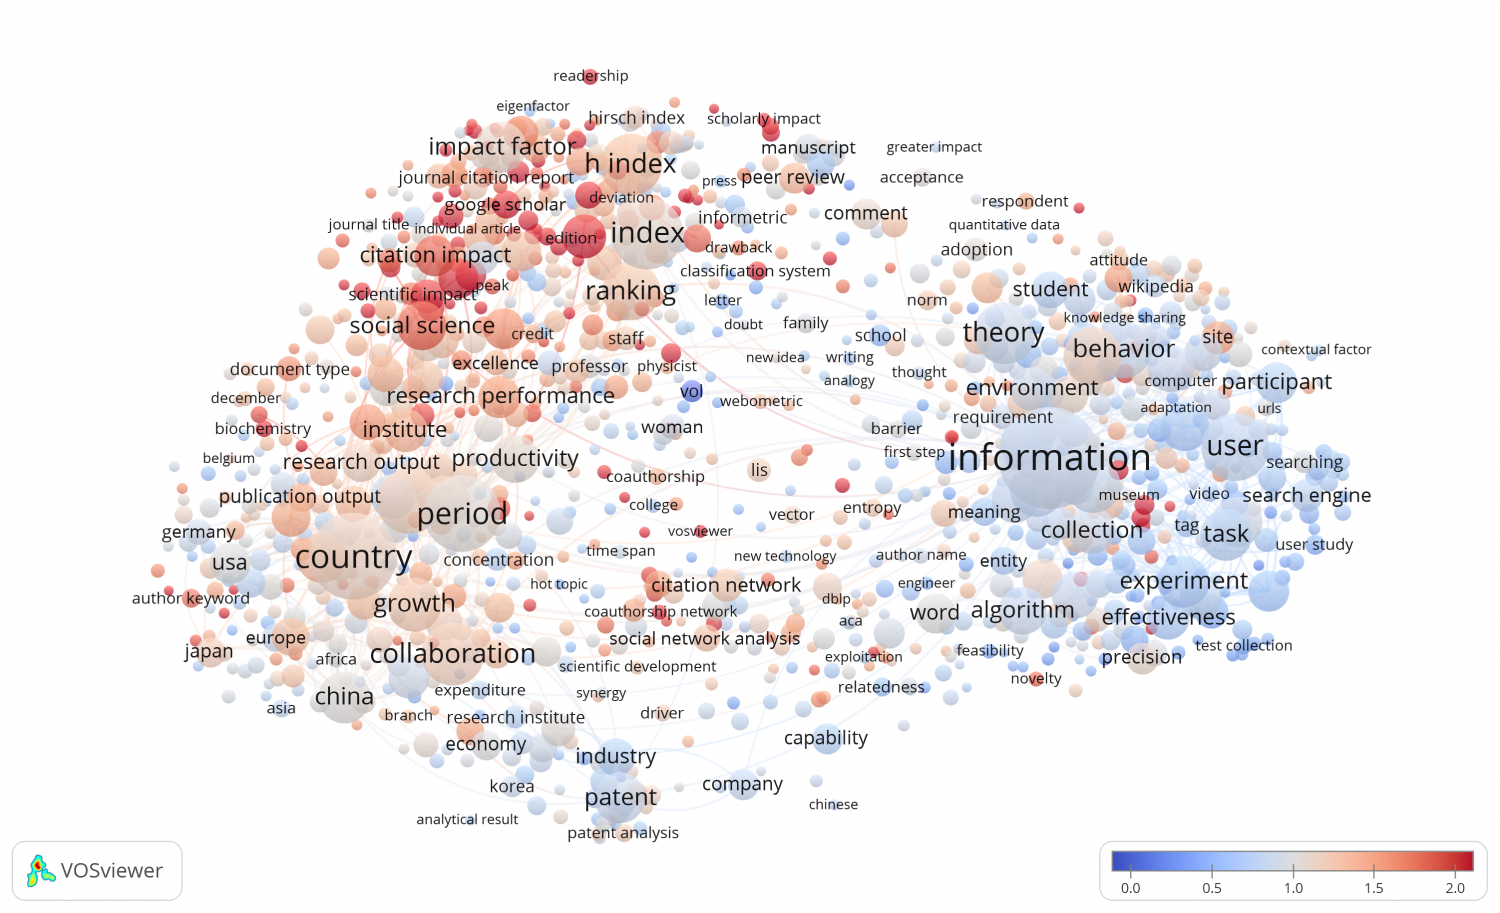
Overlay visualization using the coolwarm color scheme.
New colors for the network visualization
The colors used in the network visualization have also been revised. In the network visualization, colors indicate the cluster to which an item belongs. In VOSviewer version 1.6.7, a slightly modified version of Matplotlib’s tab20 color scheme is introduced. The new color scheme provides colors for 18 clusters. As can be seen in the visualizations presented below, for the most prominent clusters the color is reasonably similar to the color used in previous versions of VOSviewer, although the colors tend to be a little less bright. Sometimes there are more than 18 clusters in a map. Only the first 18 clusters then have their own color in the new version of VOSviewer. The remaining clusters are colored grey. This is similar to the approach taken in our CitNetExplorer software. It differs from previous versions of VOSviewer, in which each cluster had its own color, but the colors were often very similar, making it hard to distinguish between them.
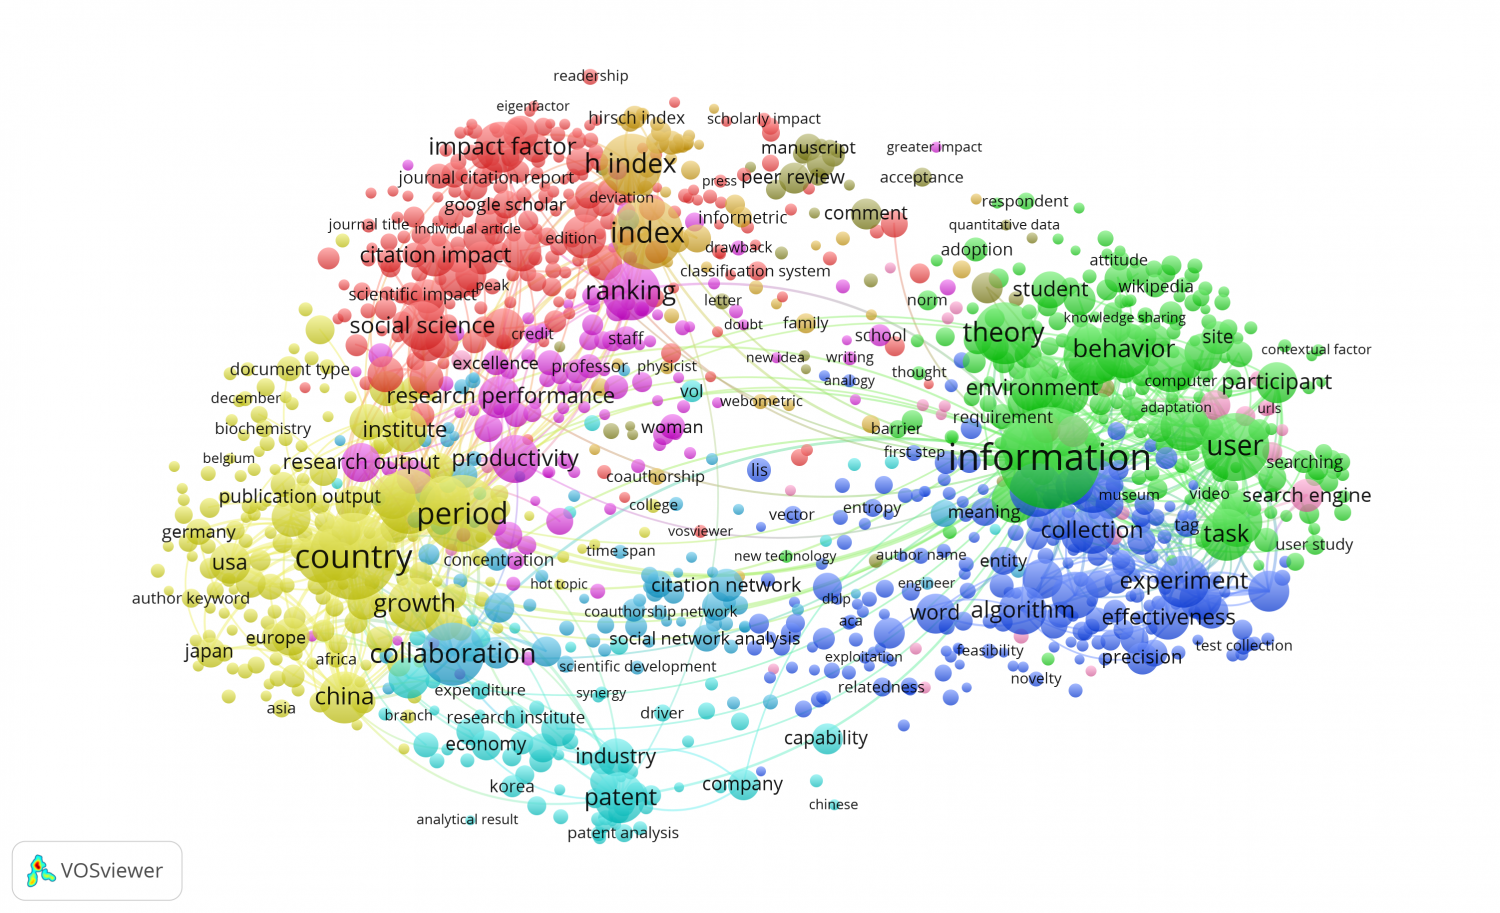
Network visualization using the old color scheme.
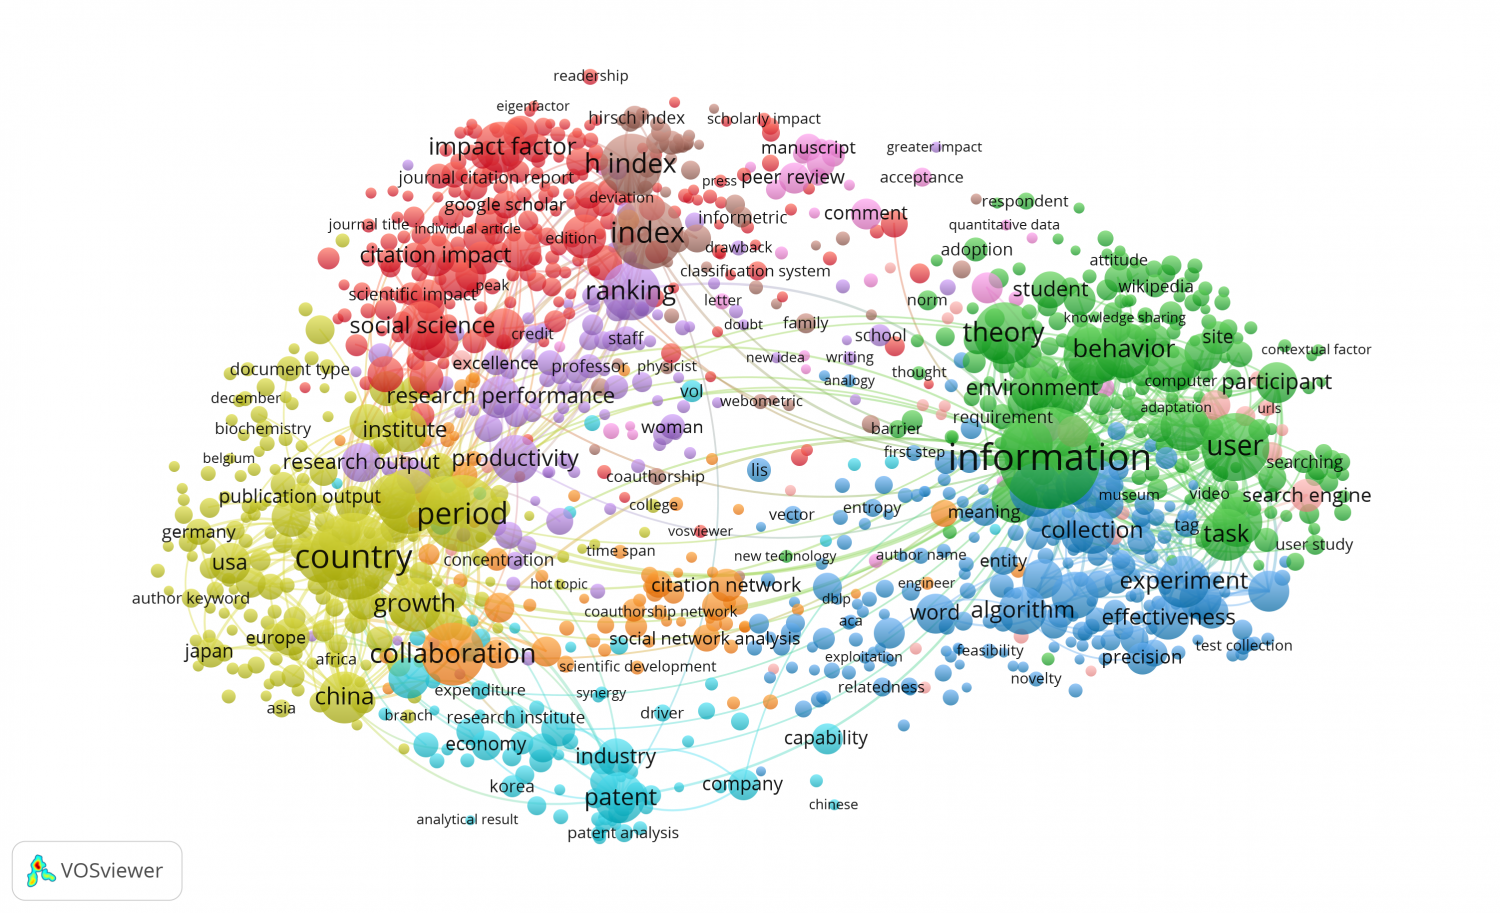
Network visualization using the new color scheme (tab20).
Conclusion
To a certain extent, the choice of colors will of course always remain a matter of taste. Nevertheless, in the new version 1.6.7 of our VOSviewer software, we aim to provide better guidance in choosing colors and to offer more reasonable default color choices. We hope that many VOSviewer users will appreciate the new colors introduced in the software.