Open access publishing and gender diversity are among the most heavily debated issues in science policy. To inform the debate on these important topics, the 2019 edition of the CWTS Leiden Ranking, released earlier today, introduces indicators of open access publishing and gender diversity. These indicators, made available for all 963 universities worldwide included in the ranking, offer a large amount of systematic evidence on open access publishing and gender diversity at the level of research-intensive higher education institutions.
Open access indicators
The Leiden Ranking is based on data from Web of Science. We calculated the open access indicators in the Leiden Ranking 2019 by combining data from Web of Science and Unpaywall. Following a recent study on open access publishing, indicators are provided for four types of open access:
- Gold. Publications in an open access journal.
- Hybrid. Publications in a subscription journal that are open access.
- Bronze. Publications in a journal that are open access without a license.
- Green. Publications in a journal that are also available in an open access repository.
In addition, we also provide an indicator of overall open access publishing, combining the gold, hybrid, bronze, and green forms of open access. More information about the open access indicators made available in the Leiden Ranking 2019 is provided in a blog post by our colleagues Thed van Leeuwen, Rodrigo Costas, and Nicolas Robinson-Garcia.
The open access indicators in the Leiden Ranking 2019 provide clear evidence of the growth of open access publishing. The top-left plot in the figure below shows that for most universities the share of open access publications is substantially higher in the period 2014–2017 than in the period 2006–2009. In Europe in particular, there has been a strong growth in open access publishing, as shown in the top-right plot. Compared to Europe, the prevalence of open access publishing is lower in North America and especially in Asia, and the growth in open access publishing has been more modest in these parts of the world.
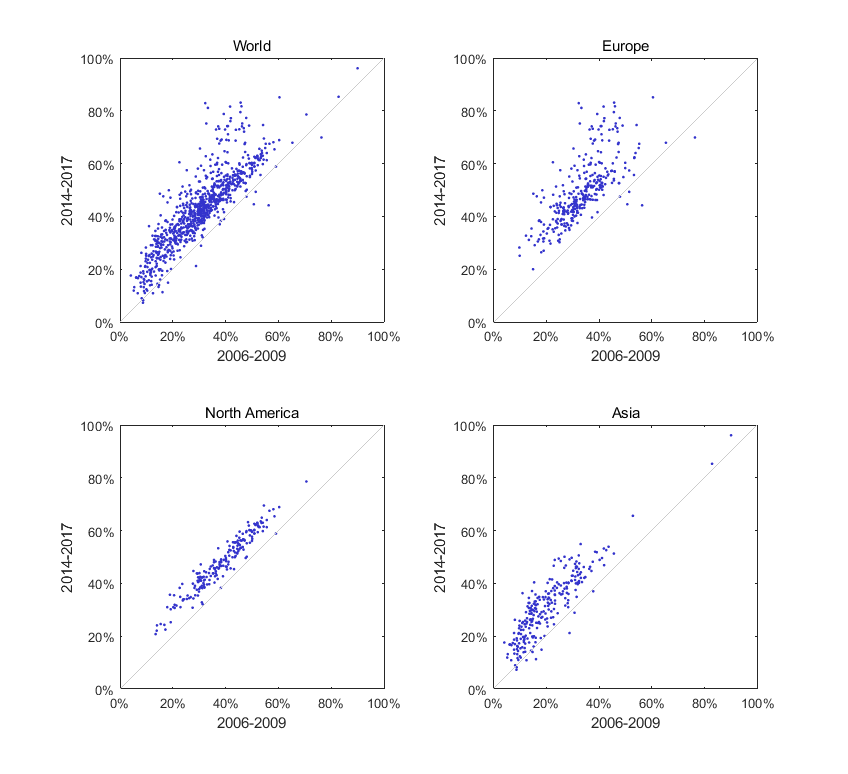
Percentage of open access publications
Gender indicators
To obtain the gender indicators introduced in the Leiden Ranking 2019, we tried to determine for all publications of a university the gender of the authors affiliated with the university. This was done based on the first name of an author combined with the country of the author. We made use of Gender API together with Genderize.io and Gender Guesser. Only gender assignments with an accuracy of at least 90% were taken into account. When an accurate gender assignment could not be made, we considered the gender of an author to be unknown. More details on the gender indicator methodology can be found here.
Of the authors of publications from the period 2014–2017, 31% has an unknown gender. This is the case in particular for authors affiliated with Chinese universities. For most of these universities, between 50% and 75% of the authors have an unknown gender. For all 963 universities in the Leiden Ranking 2019, we find that 70% of the authors to which a gender could be assigned are male and 30% are female. This reflects a well-known gender disparity in science.
Comparing the periods 2006–2009 and 2014–2017, for most universities there has been a gradual increase in the share of female authors, as shown in the figure below. However, there are also universities for which the share of female authors has decreased. On average, European universities have a higher share of female authors than North American universities. A few universities in Eastern Europe have more than 50% female authors. Many Asian universities have low shares of female authors. We should keep in mind, however, that the reliability of the statistics for Asian universities is limited, because for many authors affiliated with Asian universities the gender cannot be determined.
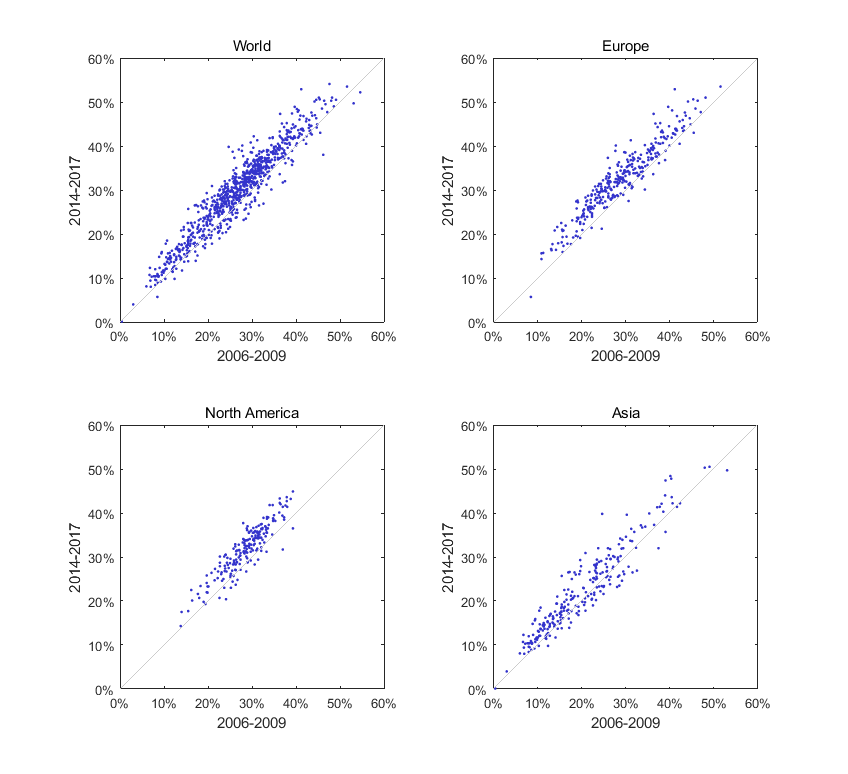
Percentage of female authorships
The gender indicators also reveal large differences between scientific fields in the share of female authors, with the share of female authors being much higher in the social sciences and humanities than in for instance mathematics and computer science. The indicators therefore partly reflect the disciplinary profile of a university. This is discussed in more detail in a blog post by Cassidy Sugimoto and Vincent Larivière, who present a more in-depth analysis of the gender indicators in the Leiden Ranking 2019.
Conclusion
The new indicators introduced in the 2019 edition of the Leiden Ranking provide large-scale systematic evidence to inform science policy discussions on open access publishing and gender diversity. The indicators can be used to trace developments over time within individual universities and to make comparisons between universities. The indicators may serve to demonstrate the need for institutional policies on open access publishing and gender diversity, and they may be used to evaluate the effects of such policies. We hope to add other similar indicators in future editions of the Leiden Ranking.
It is important to be aware of the limitations of the new indicators introduced in the Leiden Ranking 2019. The open access status of a publication cannot always be accurately determined, and there is no full agreement on the definitions of different forms of open access, such as gold, hybrid, bronze, and green. Likewise, gender assignments inevitably suffer from inaccuracies, and for a substantial share of all authors, we have not been able to assign a gender at all. Also, the open access and gender indicators in the Leiden Ranking 2019 have not been normalized to account for differences between scientific fields. The indicators therefore partly reflect field-specific patterns in open access publishing and gender diversity. In future editions of the Leiden Ranking, we expect to make further improvements to the newly introduced indicators. To support us in improving the Leiden Ranking, your feedback is always very much appreciated.